This particular indicator sits at the bottom of the chart and moves based on the market. You can adjust the inputs to tweak the information to your particular market timing and if you are looking long term of short term. Testing is an important aspect of any indicator and should be taken seriously. MacroAxis has many tools and research help that can point you in the right direction. Using the ATR is popular and information can be found readily.
Normalized-Average-True-Range
| By Nathan Young | Macroaxis Story |
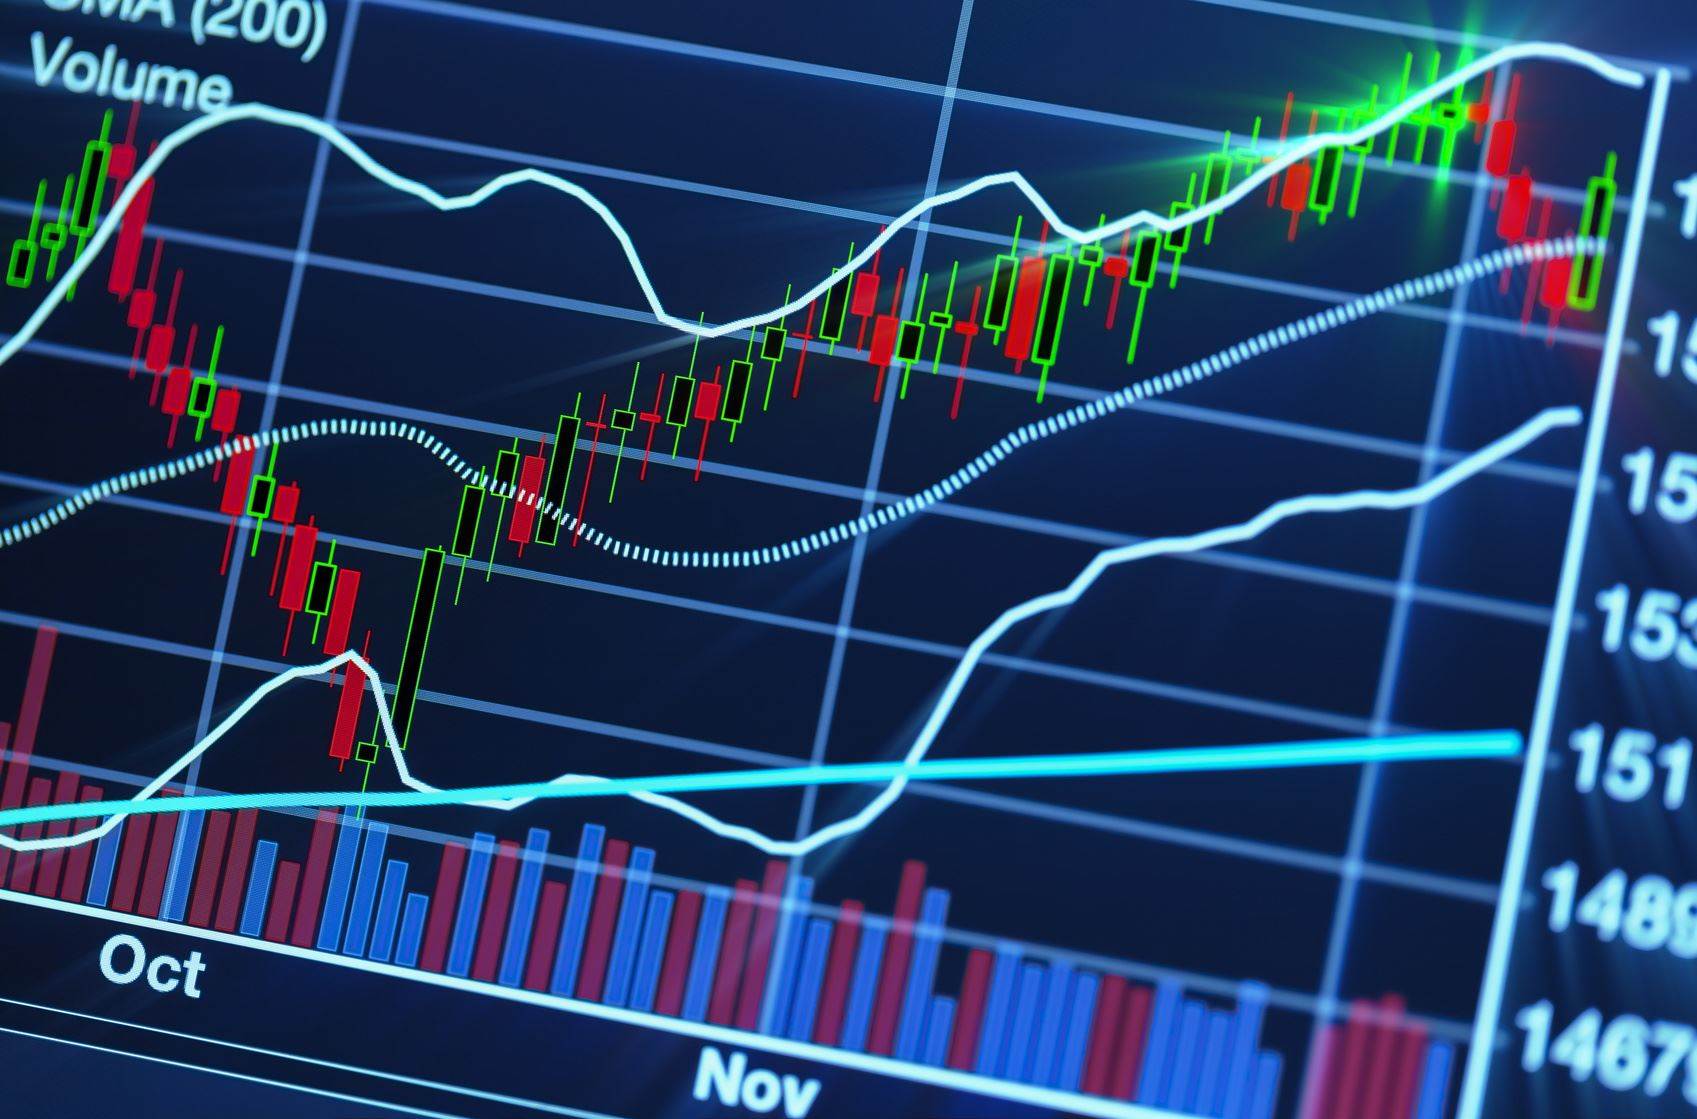
There are many indicators and tools out there and the average true range is one of the more popular. The average true range or ATR for short, is measuring the range of a particular set of data. Normalized Average True Range is trying to normalize the data and give you a consistent stream of information to base your decisions off of.
Updated over a year ago View currently updated edicational stories | Filter Normalized Average True Range |
Macroaxis uses a strict editorial review process to publish stories and blog posts. Our publishers support our company and may receive a small commission when the partner links or references are utilized. Commissions do not affect the opinions or evaluations of our editorial team. The information our editors and media partners deliver is confidential and licensed for your sole use as a Macroaxis user. We reserve all rights to the content of this article, and therefore copying or distributing this story in whole or in part is strictly prohibited.
Reviewed by Rifka Kats
Instead of getting hung up on the normalized portion of this tool, focus on the average true range and understand what that is about. The Normalized portion is just an addition to the equation on how the data is calculated. Average true range is helping in looking at the volatility of a market rather than price. Volatility is important for those who are using options in their portfolios because you want to get a good premium in a more volatile market than one that is flat.
Building efficient market-beating portfolios requires time, education, and a lot of computing power!
The Portfolio Architect is an AI-driven system that provides multiple benefits to our users by leveraging cutting-edge machine learning algorithms, statistical analysis, and predictive modeling to automate the process of asset selection and portfolio construction, saving time and reducing human error for individual and institutional investors.
Try AI Portfolio ArchitectEditorial Staff
This story should be regarded as informational only and should not be considered a solicitation to sell or buy any financial products. Macroaxis does not express any opinion as to the present or future value of any investments referred to in this post. This post may not be reproduced without the consent of Macroaxis LLC. Please refer to our Terms of Use for any information regarding our disclosure principles.
Would you like to provide feedback on the content of this article?
You can get in touch with us directly or send us a quick note via email to editors@macroaxis.comDid you try this?
Run Bollinger Bands Now
Bollinger BandsUse Bollinger Bands indicator to analyze target price for a given investing horizon |
| All Next | Launch Module |
Check out Investing Opportunities to better understand how to build diversified portfolios. Also, note that the market value of any private could be tightly coupled with the direction of predictive economic indicators such as signals in estimate. You can also try the FinTech Suite module to use AI to screen and filter profitable investment opportunities.
Other Consideration for investing
| Options Analysis Analyze and evaluate options and option chains as a potential hedge for your portfolios | |
| Stock Screener Find equities using a custom stock filter or screen asymmetry in trading patterns, price, volume, or investment outlook. | |
| Content Syndication Quickly integrate customizable finance content to your own investment portal | |
| Price Ceiling Movement Calculate and plot Price Ceiling Movement for different equity instruments | |
| Share Portfolio Track or share privately all of your investments from the convenience of any device | |
| Portfolio Volatility Check portfolio volatility and analyze historical return density to properly model market risk | |
| Sectors List of equity sectors categorizing publicly traded companies based on their primary business activities | |
| Efficient Frontier Plot and analyze your portfolio and positions against risk-return landscape of the market. | |
| Price Transformation Use Price Transformation models to analyze the depth of different equity instruments across global markets | |
| Instant Ratings Determine any equity ratings based on digital recommendations. Macroaxis instant equity ratings are based on combination of fundamental analysis and risk-adjusted market performance |